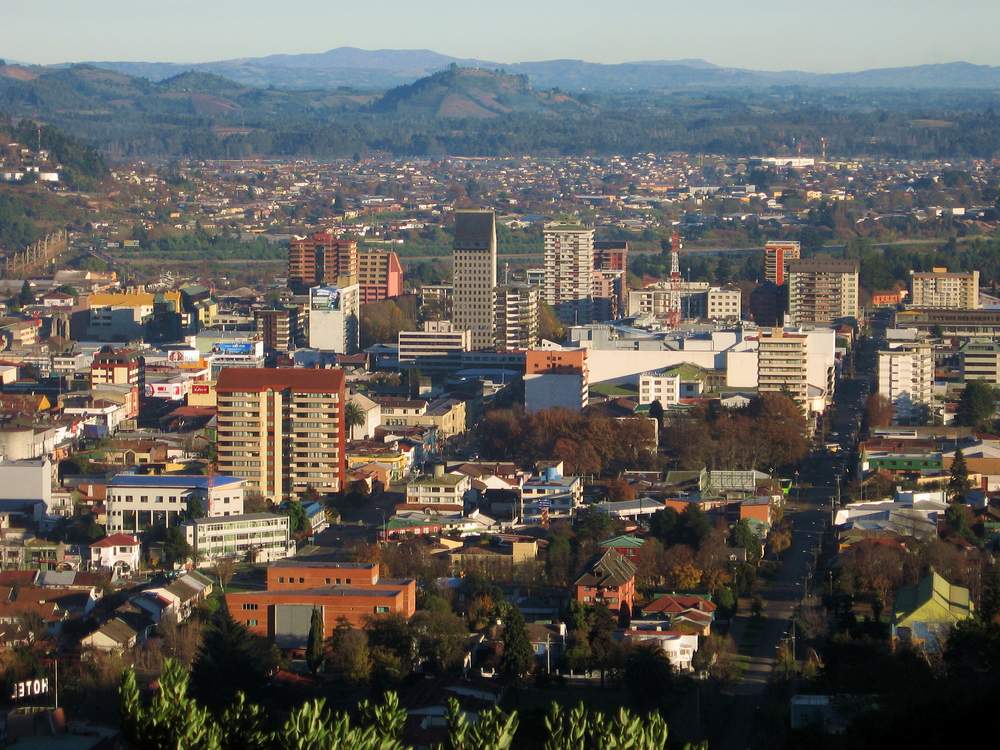
Categories a Cholchol
Indústries
Distribució d'empreses per indústria a Cholchol
| Descripció de la Indústria | Nombre d'establiments |
|---|---|
| Educació | 15 |
| Restaurants | 7 |
Dades de Cholchol
| àrea | 445.1 km² |
| Població | 12.504 |
| Població masculina | 6.300 (50.4%) |
| Població femenina | 6.204 (49.6%) |
| Canvi de població (1975 to 2020) | +84.6% |
| Canvi de població (2000 to 2020) | +21.6% |
| Edat mitjana | 27.3 anys (Home: 27.9, Dona: 26.8) |
| PIB per càpita (PPA) | $16.840 (2022) |
| Hora local | |
| Zona horària | Hora estàndard de Xile |
| Lat. i lon. | -38.60183, -72.84572 |
Mapa de: Cholchol
Mapa interactiu
Població de Cholchol
Anys 1975 a 2030
| Data | 1975 | 1990 | 2000 | 2015 | 2020 | 2025* | 2030* |
|---|---|---|---|---|---|---|---|
| Població | 6.775 | 9.037 | 10.284 | 10.974 | 12.504 | 12.983 | 13.214 |
| Densitat de població | 15,2 / km² | 20,3 / km² | 23,1 / km² | 24,7 / km² | 28,1 / km² | 29,2 / km² | 29,7 / km² |
Canvi de població de Cholchol des de 2000 fins a 2020
Augment del 21.6% des de l'any 2000 fins al 2020
| Ubicació | Canvi des de 1975 | Canvi des de 1990 | Canvi des de 2000 |
|---|---|---|---|
| Cholchol | +84.6% | +38.4% | +21.6% |
| Araucanía | — | — | — |
| Xile | — | — | — |
Edat mediana de Cholchol
Edat mediana: 27.3 anys
| Ubicació | Edat mitjana | Edat mitjana (dona) | Edat mitjana (masculí) |
|---|---|---|---|
| Cholchol | 27.3 yrs | 26.8 yrs | 27.9 yrs |
| Araucanía | 30.3 yrs | 31 yrs | 29.7 yrs |
| Xile | 31.3 yrs | 32 yrs | 30.6 yrs |
Densitat de població de Cholchol
Densitat de població: 28,1 / km²
| Ubicació | Població | àrea | Densitat |
|---|---|---|---|
| Cholchol | 12.504 | 445,1 km² | 28,1 / km² |
| Araucanía | 1 million | 31.793,4 km² | 31,5 / km² |
| Xile | 17,8 million | 751.744,8 km² | 23,7 / km² |
Població històrica i projectada de Cholchol
Població estimada des de 1880 fins a 2100
- JRC (European Commission's Joint Research Centre) treball al GHS built-up grid
- CIESIN (Center for International Earth Science Information Network)
- [Enllaç] Klein Goldewijk, K., Beusen, A., Doelman, J., and Stehfest, E.: Anthropogenic land use estimates for the Holocene – HYDE 3.2, Earth Syst. Sci. Data, 9, 927–953, https://doi.org/10.5194/essd-9-927-2017, 2017.
Índex de desenvolupament humà (HDI)
Índex compost estadístic de l'esperança de vida, l'educació i la renda per càpita.
Producte Interior Brut (PIB) de Cholchol
PIB per càpita, PPA ($ internacionals constants de 2017)
| Data | 1990 | 1995 | 2000 | 2005 | 2010 | 2015 | 2020 | 2022 |
|---|---|---|---|---|---|---|---|---|
| PIB per càpita | $4.896 | $6.784 | $7.265 | $9.506 | $11.371 | $13.859 | $14.660 | $16.840 |
| PIB total | $46,1 M | $67,4 M | $73,2 M | $96,8 M | $117,7 M | $150,2 M | $175,5 M | $204,9 M |
Emissions de CO2 de Cholchol
Emissions de diòxid de carboni (CO2) per càpita en tones a l'any
| Ubicació | Emissions de CO2 | Emissions de CO2 per càpita | Intensitat d'emissions de CO2 |
|---|---|---|---|
| Cholchol | 58,330 tn | 4.66 tn | 131 tons/km² |
| Araucanía | 4,403,719 tn | 4.39 tn | 138.5 tons/km² |
| Xile | 87,296,657 tn | 4.91 tn | 116.1 tons/km² |
| Emissions de CO2 de 2013 (tones/any) | 58,330 tn |
| Emissions de CO2 de 2013 (tones/any) per capita | 4.66 tn |
| Intensitat d'emissions de CO2 de 2013 (tones/km²/any) | 131 tons/km² |
Riscos naturals
Risc sobre 10
| Perill | Nivell de risc |
|---|---|
| Inundació | Mitjà (7) |
| Terratrèmol | Alt (9) |
| Esllavissament de terra | Alt (8) |
* El risc, sobretot pel que fa a inundacions o esllavissades de terra, pot no ser de tota la zona.
- Dilley, M., R.S. Chen, U. Deichmann, A.L. Lerner-Lam, M. Arnold, J. Agwe, P. Buys, O. Kjekstad, B. Lyon, and G. Yetman. 2005. Natural Disaster Hotspots: A Global Risk Analysis. Washington, D.C.: World Bank. https://doi.org/10.1596/0-8213-5930-4.
- Center for Hazards and Risk Research - CHRR - Columbia University, Center for International Earth Science Information Network - CIESIN - Columbia University, and Norwegian Geotechnical Institute - NGI. 2005. Global Landslide Hazard Distribution. Palisades, NY: NASA Socioeconomic Data and Applications Center (SEDAC). https://doi.org/10.7927/H4P848VZ.
- Center for Hazards and Risk Research - CHRR - Columbia University, Center for International Earth Science Information Network - CIESIN - Columbia University. 2005. Global Flood Hazard Frequency and Distribution. Palisades, NY: NASA Socioeconomic Data and Applications Center (SEDAC). https://doi.org/10.7927/H4668B3D.
- Center for Hazards and Risk Research - CHRR - Columbia University, Center for International Earth Science Information Network - CIESIN - Columbia University. 2005. Global Earthquake Hazard Distribution - Peak Ground Acceleration. Palisades, NY: NASA Socioeconomic Data and Applications Center (SEDAC). https://doi.org/10.7927/H4BZ63ZS.
Terratrèmols propers recents
Magnitud 3.0 i superior
| Data▼ | Hora↕ | Magnitude↕ | Distance↕ | Profunditat↕ | Ubicació↕ | Enllaç |
|---|---|---|---|---|---|---|
| 6/24/19 | 4:42 AM | 4.5 | 46.4 km | 26,460 m | 19km WNW of Carahue, Chile | usgs.gov |
| 5/22/19 | 10:42 PM | 4.3 | 56 km | 81,070 m | 21km SSE of Victoria, Chile | usgs.gov |
| 7/31/18 | 12:46 PM | 4.5 | 41.2 km | 67,620 m | 4km WNW of Traiguen, Chile | usgs.gov |
| 1/25/18 | 4:03 AM | 4.4 | 62.9 km | 67,340 m | 14km NW of Victoria, Chile | usgs.gov |
| 5/20/17 | 2:13 PM | 4 | 61 km | 10,000 m | 34km SSW of Carahue, Chile | usgs.gov |
| 5/26/16 | 1:25 PM | 4.4 | 53.4 km | 27,310 m | 40km NNW of Carahue, Chile | usgs.gov |
| 11/1/15 | 1:28 AM | 4.9 | 49.7 km | 21,960 m | 19km WSW of Carahue, Chile | usgs.gov |
| 8/22/15 | 10:41 PM | 4.1 | 28.7 km | 50,900 m | 9km SW of Lautaro, Chile | usgs.gov |
| 5/11/14 | 12:46 AM | 4.1 | 53.6 km | 17,700 m | 58km SW of Lebu, Chile | usgs.gov |
| 3/20/14 | 11:53 PM | 4.6 | 64.1 km | 32,060 m | 38km SSE of Canete, Chile | usgs.gov |

Sobre les nostres dades
Les dades d'aquesta pàgina s'estimen utilitzant diverses eines i recursos disponibles públicament. Es proporciona sense garantia i pot contenir inexactituds. Utilitzeu-lo sota el vostre propi risc.