Categories a Shibecha
BenzineraAgriculturaCooperativa agrícolaCriador de bestiarFabricant de maquinària agrícolaCentral telefònicaCentre comunitariCompanyia navilieraOficina de correusOficina del govern localParc de bombersSantuari xintoistaTemple budistaConstrucció d'edificisElectricistaEducacióParvulariAtracció turísticaReserva de la naturaBotiga de CafèBotigues de queviures i supermercatsCafèsLleteriaRestaurant especialitzat en izakayaRestaurantsSnack-barCaixers automàticsAgència de serveis d'atenció a la tercera edatCementiriBarbersPerruqueriaEdifici d'apartamentsCompresLes botigues de conveniènciaRanxoCàmpingEls parcs públicsZona de piragüismeHotels i motelsMiradorparada de trenIlocalitzable
Indústries
Distribució d'empreses per indústria a Shibecha
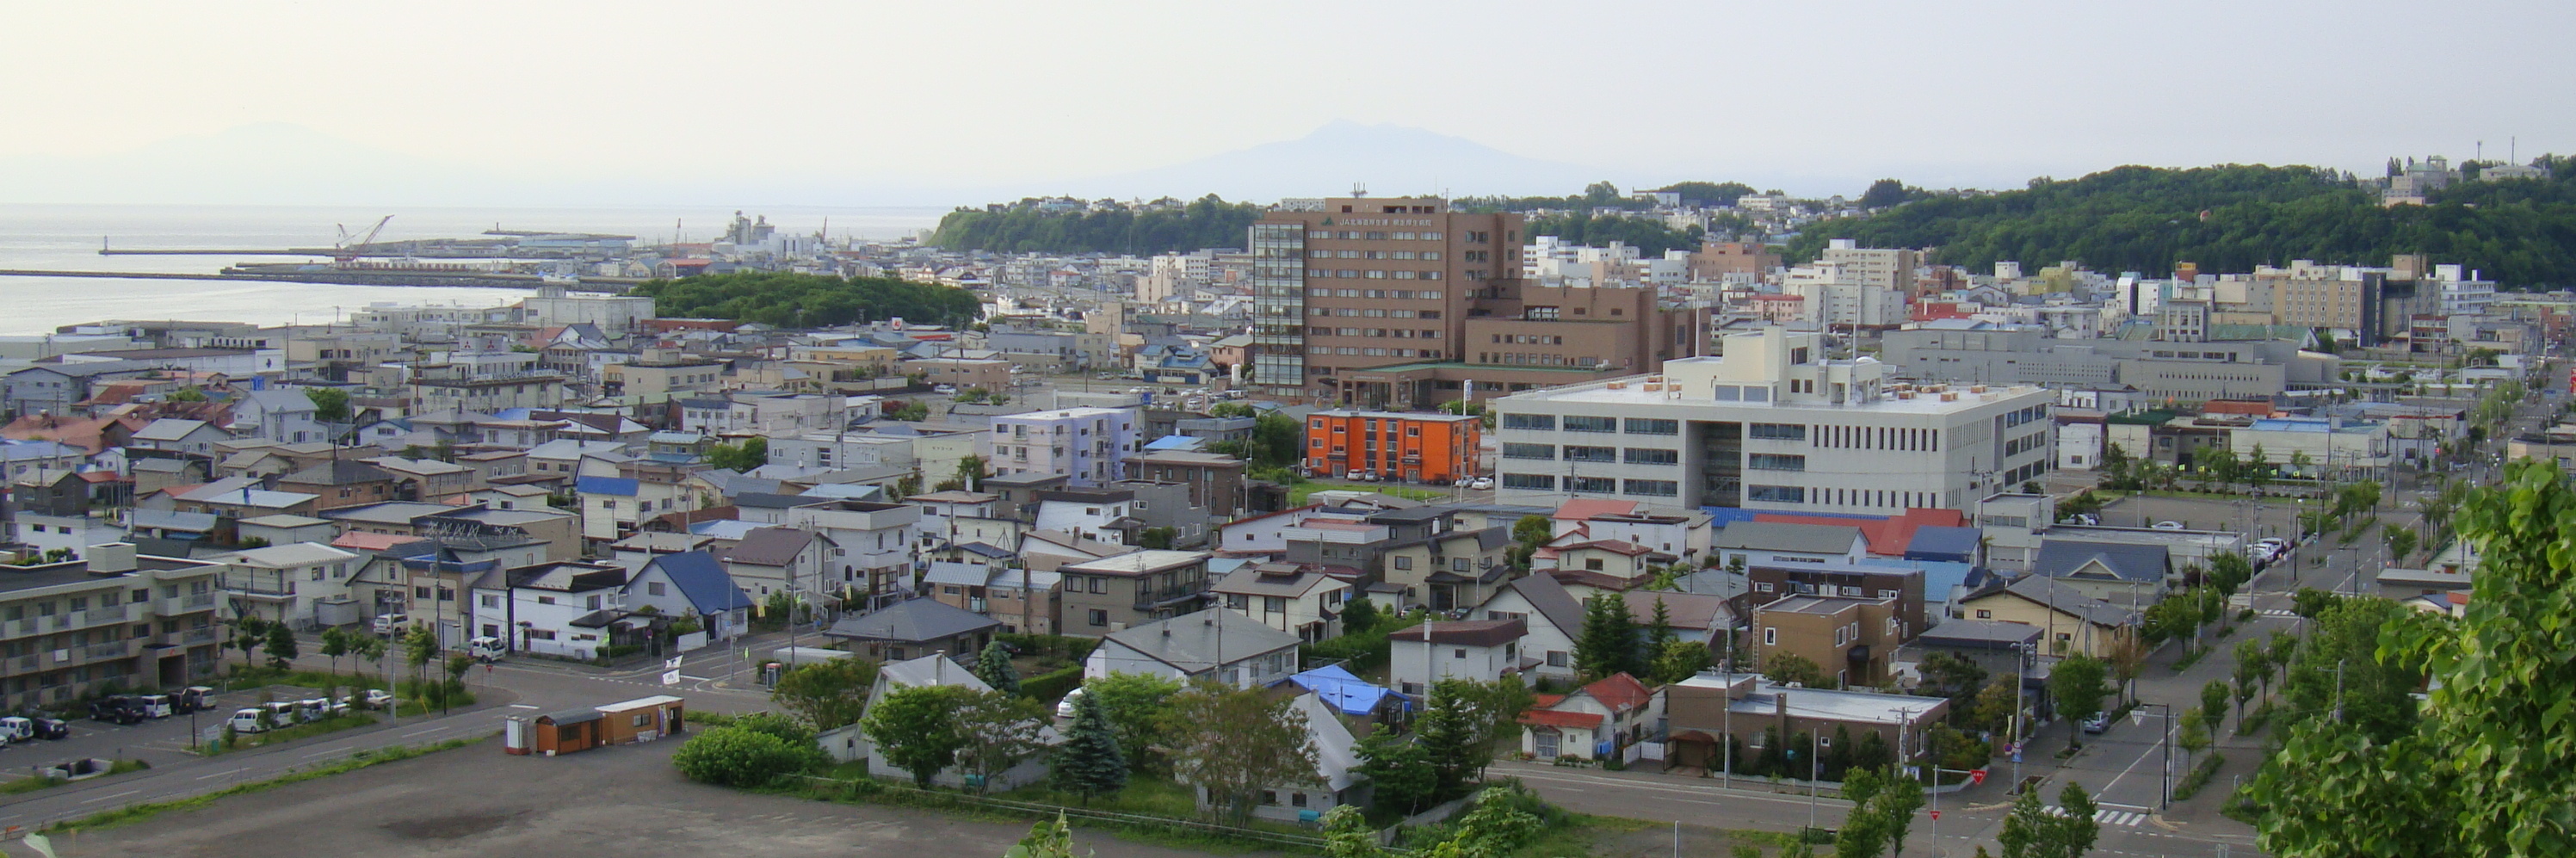
Dades de Shibecha
| àrea | 0.3 km² |
| Població | 2 |
| Barris | Asahi, 2 Chome, Kaiun, 9 Chome, Asahi, 1 Chome, Heiwa, 9 Chome, Kaiun, 10 Chome |
| Hora local | |
| Zona horària | Hora estàndard del Japó |
| Lat. i lon. | 43.29278, 144.60056 |
| Codis Postals | 088 |
Mapa de: Shibecha
Mapa interactiu
Població de Shibecha
Anys 1975 a 2020
| Data | 1975 | 1990 | 2000 | 2015 | 2020 |
|---|---|---|---|---|---|
| Població | 0 | 0 | 0 | 2 | 2 |
| Densitat de població | 0 / km² | 0 / km² | 0 / km² | 8 / km² | 8 / km² |
Fonts: JRC (European Commission's Joint Research Centre) treball al GHS built-up grid
Canvi de població de Shibecha des de 2000 fins a 2015
| Ubicació | Canvi des de 1975 | Canvi des de 1990 | Canvi des de 2000 |
|---|---|---|---|
| Shibecha | — | — | — |
| Hokkaido | -4.9% | -8% | -6.3% |
| Japó | +13.6% | +3.4% | +0.6% |
Fonts: JRC (European Commission's Joint Research Centre) treball al GHS built-up grid
Densitat de població de Shibecha
Densitat de població: 8 / km²
| Ubicació | Població | àrea | Densitat |
|---|---|---|---|
| Shibecha | 2 | 0,25 km² | 8 / km² |
| Hokkaido | 5,2 million | 83.510,2 km² | 61,9 / km² |
| Japó | 122,9 million | 373.410,9 km² | 329 / km² |
Fonts: JRC (European Commission's Joint Research Centre) treball al GHS built-up grid
Població històrica i projectada de Shibecha
Població estimada des de 1975 fins a 2100
Fonts:
- JRC (European Commission's Joint Research Centre) treball al GHS built-up grid
- CIESIN (Center for International Earth Science Information Network)
- [Enllaç] Klein Goldewijk, K., Beusen, A., Doelman, J., and Stehfest, E.: Anthropogenic land use estimates for the Holocene – HYDE 3.2, Earth Syst. Sci. Data, 9, 927–953, https://doi.org/10.5194/essd-9-927-2017, 2017.
Barris de Shibecha
Percentatge d'empreses per barri a Shibecha
Distribució de preus
Distribuició d'empresa per preu per a Shibecha
Índex de desenvolupament humà (HDI)
Índex compost estadístic de l'esperança de vida, l'educació i la renda per càpita.
Font: [Enllaç] Kummu, M., Taka, M. &Guillaume, J. Gridded global datasets for Gross Domestic Product and Human Development Index over 1990–2015. Sci Data 5, 180004 (2018) doi:10.1038/sdata.2018.4
Emissions de CO2 de Shibecha
Emissions de diòxid de carboni (CO2) per càpita en tones a l'any
| Ubicació | Emissions de CO2 | Emissions de CO2 per càpita | Intensitat d'emissions de CO2 |
|---|---|---|---|
| Shibecha | 2 tn | 0.95 tn | 7.6 tons/km² |
| Hokkaido | 8,083,022 tn | 1.56 tn | 96.8 tons/km² |
| Japó | 541,995,101 tn | 4.41 tn | 1,451.5 tons/km² |
Fonts: [Enllaç] Moran, D., Kanemoto K; Jiborn, M., Wood, R., Többen, J., and Seto, K.C. (2018) Carbon footprints of 13,000 cities. Environmental Research Letters DOI: 10.1088/1748-9326/aac72a
Emissions de CO2 de Shibecha
| Emissions de CO2 de 2013 (tones/any) | 2 tn |
| Emissions de CO2 de 2013 (tones/any) per capita | 0.95 tn |
| Intensitat d'emissions de CO2 de 2013 (tones/km²/any) | 7.6 tons/km² |
Riscos naturals
Risc sobre 10
| Perill | Nivell de risc |
|---|---|
| Terratrèmol | Alt (9) |
| Cicló | Alt (9) |
| Esllavissament de terra | Mitjà (6) |
* El risc, sobretot pel que fa a inundacions o esllavissades de terra, pot no ser de tota la zona.
Fonts:
- Dilley, M., R.S. Chen, U. Deichmann, A.L. Lerner-Lam, M. Arnold, J. Agwe, P. Buys, O. Kjekstad, B. Lyon, and G. Yetman. 2005. Natural Disaster Hotspots: A Global Risk Analysis. Washington, D.C.: World Bank. https://doi.org/10.1596/0-8213-5930-4.
- Center for Hazards and Risk Research - CHRR - Columbia University, Center for International Earth Science Information Network - CIESIN - Columbia University, and Norwegian Geotechnical Institute - NGI. 2005. Global Landslide Hazard Distribution. Palisades, NY: NASA Socioeconomic Data and Applications Center (SEDAC). https://doi.org/10.7927/H4P848VZ.
- Center for Hazards and Risk Research - CHRR - Columbia University, Center for International Earth Science Information Network - CIESIN - Columbia University, International Bank for Reconstruction and Development - The World Bank, and United Nations Environment Programme Global Resource Information Database Geneva - UNEP/GRID-Geneva. 2005. Global Cyclone Hazard Frequency and Distribution. Palisades, NY: NASA Socioeconomic Data and Applications Center (SEDAC). https://doi.org/10.7927/H4CZ353K.
- Center for Hazards and Risk Research - CHRR - Columbia University, Center for International Earth Science Information Network - CIESIN - Columbia University. 2005. Global Earthquake Hazard Distribution - Peak Ground Acceleration. Palisades, NY: NASA Socioeconomic Data and Applications Center (SEDAC). https://doi.org/10.7927/H4BZ63ZS.
Terratrèmols propers recents
Magnitud 3.0 i superior
| Data▼ | Hora↕ | Magnitude↕ | Distance↕ | Profunditat↕ | Ubicació↕ | Enllaç |
|---|---|---|---|---|---|---|
| 6/15/19 | 8:20 AM | 4.5 | 48.7 km | 54,070 m | 44km E of Kushiro, Japan | usgs.gov |
| 5/29/19 | 2:09 PM | 4.2 | 13 km | 143,480 m | 40km N of Kushiro, Japan | usgs.gov |
| 11/14/18 | 9:09 AM | 4.4 | 36.1 km | 110,480 m | 35km SSW of Shibetsu, Japan | usgs.gov |
| 5/8/16 | 7:58 AM | 4 | 40.4 km | 98,130 m | 39km WSW of Nemuro, Japan | usgs.gov |
| 3/30/16 | 5:09 AM | 4.8 | 42.2 km | 54,160 m | 26km ESE of Kushiro, Japan | usgs.gov |
| 9/19/15 | 2:01 PM | 4.4 | 38.4 km | 40,250 m | 48km S of Bihoro, Japan | usgs.gov |
| 6/15/15 | 8:38 AM | 4.2 | 32.2 km | 10,000 m | 46km NNW of Kushiro, Japan | usgs.gov |
| 1/20/15 | 1:46 PM | 4.1 | 32.9 km | 122,690 m | 7km N of Kushiro, Japan | usgs.gov |
| 1/8/15 | 6:42 PM | 5.3 | 49.3 km | 132,330 m | 21km W of Shibetsu, Japan | usgs.gov |
| 11/15/14 | 5:40 PM | 4.4 | 22.8 km | 133,980 m | 31km N of Kushiro, Japan | usgs.gov |


Sobre les nostres dades
Les dades d'aquesta pàgina s'estimen utilitzant diverses eines i recursos disponibles públicament. Es proporciona sense garantia i pot contenir inexactituds. Utilitzeu-lo sota el vostre propi risc.