Categories a Ōmu
Proveïdor de productes alimentarisAjuntamentCentre comunitariOficina del govern localSantuari xintoistaTemple budistaConstrucció d'edificisLloc panoràmicCafèsPeixateriaRestaurant especialitzat en izakayaRestaurantsSnack-barCaixers automàticsCementiriBarbersPerruqueriaLes botigues de conveniènciaRanxoEls parcs públicsRampa per a vaixellsIlocalitzable
Indústries
Distribució d'empreses per indústria a Ōmu
Dades de Ōmu
| àrea | 3.2 km² |
| Població | 1.679 |
| Canvi de població (1975 to 2020) | -27.6% |
| Canvi de població (2000 to 2020) | -24.3% |
| Barris | Omu, Saiwaicho Omu, Omu, Gyoden, Omu, Kaisei, Omu, Honcho |
| Hora local | |
| Zona horària | Hora estàndard del Japó |
| Lat. i lon. | 44.57778, 142.96134 |
| Codis Postals | 098 |
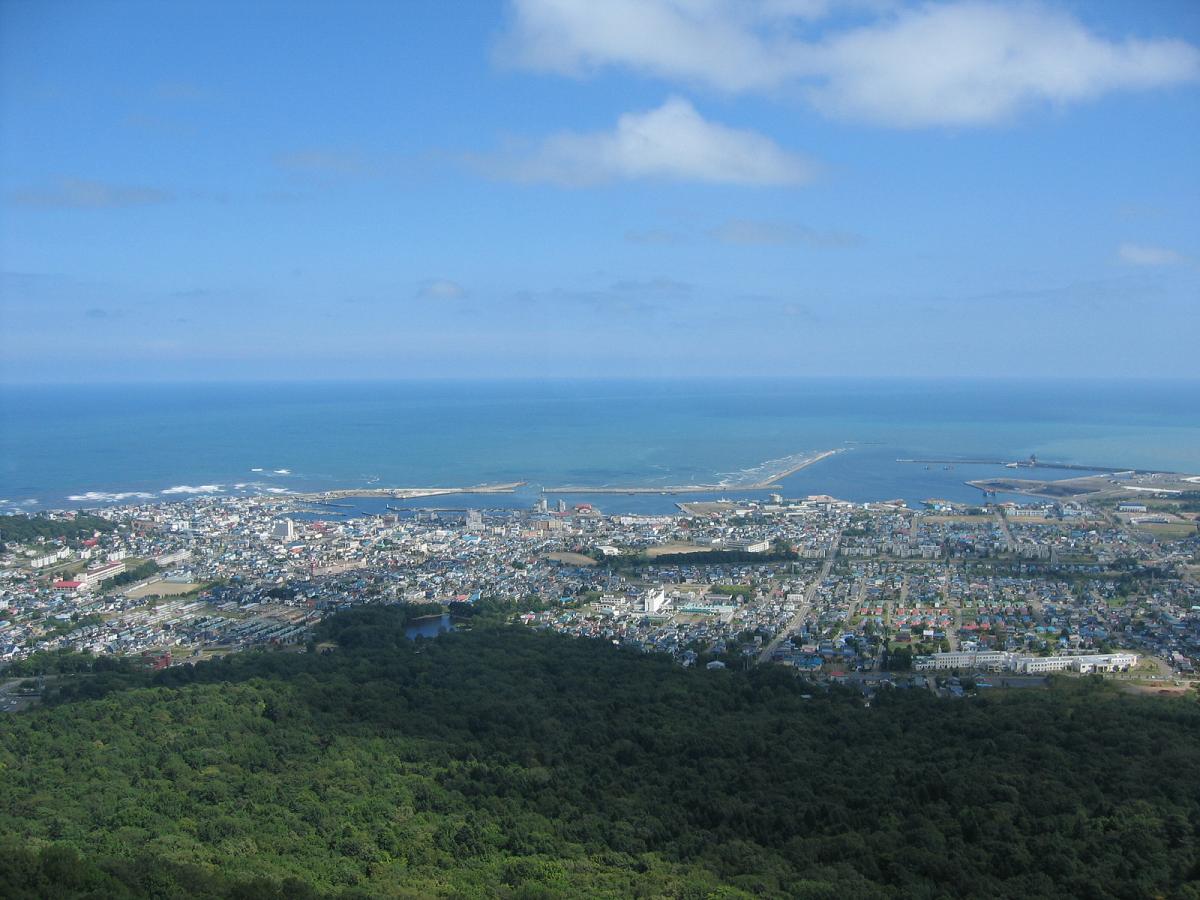
Mapa de: Ōmu
Mapa interactiu
Població de Ōmu
Anys 1975 a 2020
| Data | 1975 | 1990 | 2000 | 2015 | 2020 |
|---|---|---|---|---|---|
| Població | 2.319 | 2.351 | 2.219 | 1.769 | 1.679 |
| Densitat de població | 727,5 / km² | 737,6 / km² | 696,2 / km² | 555 / km² | 526,7 / km² |
Fonts: JRC (European Commission's Joint Research Centre) treball al GHS built-up grid
Canvi de població de Ōmu des de 2000 fins a 2015
Disminució del 20.3% des de l'any 2000 fins al 2015
| Ubicació | Canvi des de 1975 | Canvi des de 1990 | Canvi des de 2000 |
|---|---|---|---|
| Ōmu | -23.7% | -24.8% | -20.3% |
| Hokkaido | -4.9% | -8% | -6.3% |
| Japó | +13.6% | +3.4% | +0.6% |
Fonts: JRC (European Commission's Joint Research Centre) treball al GHS built-up grid
Densitat de població de Ōmu
Densitat de població: 527 / km²
| Ubicació | Població | àrea | Densitat |
|---|---|---|---|
| Ōmu | 1.679 | 3,188 km² | 527 / km² |
| Hokkaido | 5,2 million | 83.510,2 km² | 61,9 / km² |
| Japó | 122,9 million | 373.410,9 km² | 329 / km² |
Fonts: JRC (European Commission's Joint Research Centre) treball al GHS built-up grid
Població històrica i projectada de Ōmu
Població estimada des de 100 fins a 2100
Fonts:
- JRC (European Commission's Joint Research Centre) treball al GHS built-up grid
- CIESIN (Center for International Earth Science Information Network)
- [Enllaç] Klein Goldewijk, K., Beusen, A., Doelman, J., and Stehfest, E.: Anthropogenic land use estimates for the Holocene – HYDE 3.2, Earth Syst. Sci. Data, 9, 927–953, https://doi.org/10.5194/essd-9-927-2017, 2017.
Barris de Ōmu
Percentatge d'empreses per barri a Ōmu
Índex de desenvolupament humà (HDI)
Índex compost estadístic de l'esperança de vida, l'educació i la renda per càpita.
Font: [Enllaç] Kummu, M., Taka, M. &Guillaume, J. Gridded global datasets for Gross Domestic Product and Human Development Index over 1990–2015. Sci Data 5, 180004 (2018) doi:10.1038/sdata.2018.4
Emissions de CO2 de Ōmu
Emissions de diòxid de carboni (CO2) per càpita en tones a l'any
| Ubicació | Emissions de CO2 | Emissions de CO2 per càpita | Intensitat d'emissions de CO2 |
|---|---|---|---|
| Ōmu | 1,589 tn | 0.95 tn | 498.6 tons/km² |
| Hokkaido | 8,083,022 tn | 1.56 tn | 96.8 tons/km² |
| Japó | 541,995,101 tn | 4.41 tn | 1,451.5 tons/km² |
Fonts: [Enllaç] Moran, D., Kanemoto K; Jiborn, M., Wood, R., Többen, J., and Seto, K.C. (2018) Carbon footprints of 13,000 cities. Environmental Research Letters DOI: 10.1088/1748-9326/aac72a
Emissions de CO2 de Ōmu
| Emissions de CO2 de 2013 (tones/any) | 1,589 tn |
| Emissions de CO2 de 2013 (tones/any) per capita | 0.95 tn |
| Intensitat d'emissions de CO2 de 2013 (tones/km²/any) | 498.6 tons/km² |
Riscos naturals
Risc sobre 10
| Perill | Nivell de risc |
|---|---|
| Terratrèmol | Baix (2) |
| Cicló | Alt (8) |
* El risc, sobretot pel que fa a inundacions o esllavissades de terra, pot no ser de tota la zona.
Fonts:
- Dilley, M., R.S. Chen, U. Deichmann, A.L. Lerner-Lam, M. Arnold, J. Agwe, P. Buys, O. Kjekstad, B. Lyon, and G. Yetman. 2005. Natural Disaster Hotspots: A Global Risk Analysis. Washington, D.C.: World Bank. https://doi.org/10.1596/0-8213-5930-4.
- Center for Hazards and Risk Research - CHRR - Columbia University, Center for International Earth Science Information Network - CIESIN - Columbia University, International Bank for Reconstruction and Development - The World Bank, and United Nations Environment Programme Global Resource Information Database Geneva - UNEP/GRID-Geneva. 2005. Global Cyclone Hazard Frequency and Distribution. Palisades, NY: NASA Socioeconomic Data and Applications Center (SEDAC). https://doi.org/10.7927/H4CZ353K.
- Center for Hazards and Risk Research - CHRR - Columbia University, Center for International Earth Science Information Network - CIESIN - Columbia University. 2005. Global Earthquake Hazard Distribution - Peak Ground Acceleration. Palisades, NY: NASA Socioeconomic Data and Applications Center (SEDAC). https://doi.org/10.7927/H4BZ63ZS.
Terratrèmols propers recents
Magnitud 3.0 i superior
| Data▼ | Hora↕ | Magnitude↕ | Distance↕ | Profunditat↕ | Ubicació↕ | Enllaç |
|---|---|---|---|---|---|---|
| 2/12/19 | 2:55 PM | 4.2 | 66.1 km | 233,800 m | 31km NW of Nayoro, Japan | usgs.gov |
| 9/24/18 | 4:53 AM | 4 | 82.8 km | 257,079 m | 101km N of Mombetsu, Japan | usgs.gov |
| 8/12/18 | 11:51 PM | 4.3 | 48.4 km | 227,450 m | 17km SE of Nayoro, Japan | usgs.gov |
| 12/14/17 | 7:25 PM | 4 | 51.2 km | 231,270 m | 14km NW of Nayoro, Japan | usgs.gov |
| 7/4/16 | 3:45 PM | 4 | 57.4 km | 206,080 m | 27km SSE of Nayoro, Japan | usgs.gov |
| 11/15/15 | 7:51 AM | 4.3 | 91.4 km | 214,060 m | 32km NW of Asahikawa, Japan | usgs.gov |
| 5/14/15 | 1:51 AM | 4.3 | 67.2 km | 43,630 m | 35km ENE of Mombetsu, Japan | usgs.gov |
| 6/1/14 | 11:46 PM | 4 | 26.8 km | 247,020 m | 28km NNE of Nayoro, Japan | usgs.gov |
| 3/1/14 | 6:03 AM | 4.6 | 80.2 km | 244,620 m | 53km NW of Nayoro, Japan | usgs.gov |
| 2/12/14 | 2:55 PM | 4.4 | 75 km | 283,420 m | 94km N of Mombetsu, Japan | usgs.gov |

Sobre les nostres dades
Les dades d'aquesta pàgina s'estimen utilitzant diverses eines i recursos disponibles públicament. Es proporciona sense garantia i pot contenir inexactituds. Utilitzeu-lo sota el vostre propi risc.