Categories a Celendín
Reparació de cotxes i mantenimentTaller de cotxesCentre comunitariEsglésiescasa developmenteCentre educatiuEducacióAtracció turísticaBars, pubs i tavernesBotigues de queviures i supermercatsRestaurantsRestaurants de menjar ràpidBancsComplex residencialAltres compresFarmàciaEls parcs públicsHotels i motels
Indústries
Distribució d'empreses per indústria a Celendín
| Descripció de la Indústria | Nombre d'establiments |
|---|---|
| Restaurants | 16 |
| Esglésies | 11 |
| Educació | 10 |
| Els parcs públics | 7 |
| Botigues de queviures i supermercats | 7 |
| Taller de cotxes | 6 |
| Hotels i motels | 6 |
| Agències de Viatges | 5 |
| Bancs | 5 |
| Compres | 5 |
| Altres grups d'empreses | 5 |
Dades de Celendín
| àrea | 330.7 km² |
| Població | 26.807 |
| Població masculina | 12.892 (48.1%) |
| Població femenina | 13.915 (51.9%) |
| Canvi de població (1975 to 2020) | +96.9% |
| Canvi de població (2000 to 2020) | +12.1% |
| Edat mitjana | 23.2 anys (Home: 22.5, Dona: 23.9) |
| Hora local | |
| Zona horària | Hora estàndard del Perú |
| Lat. i lon. | -6.86590, -78.14585 |
| Codis Postals | 06226 |
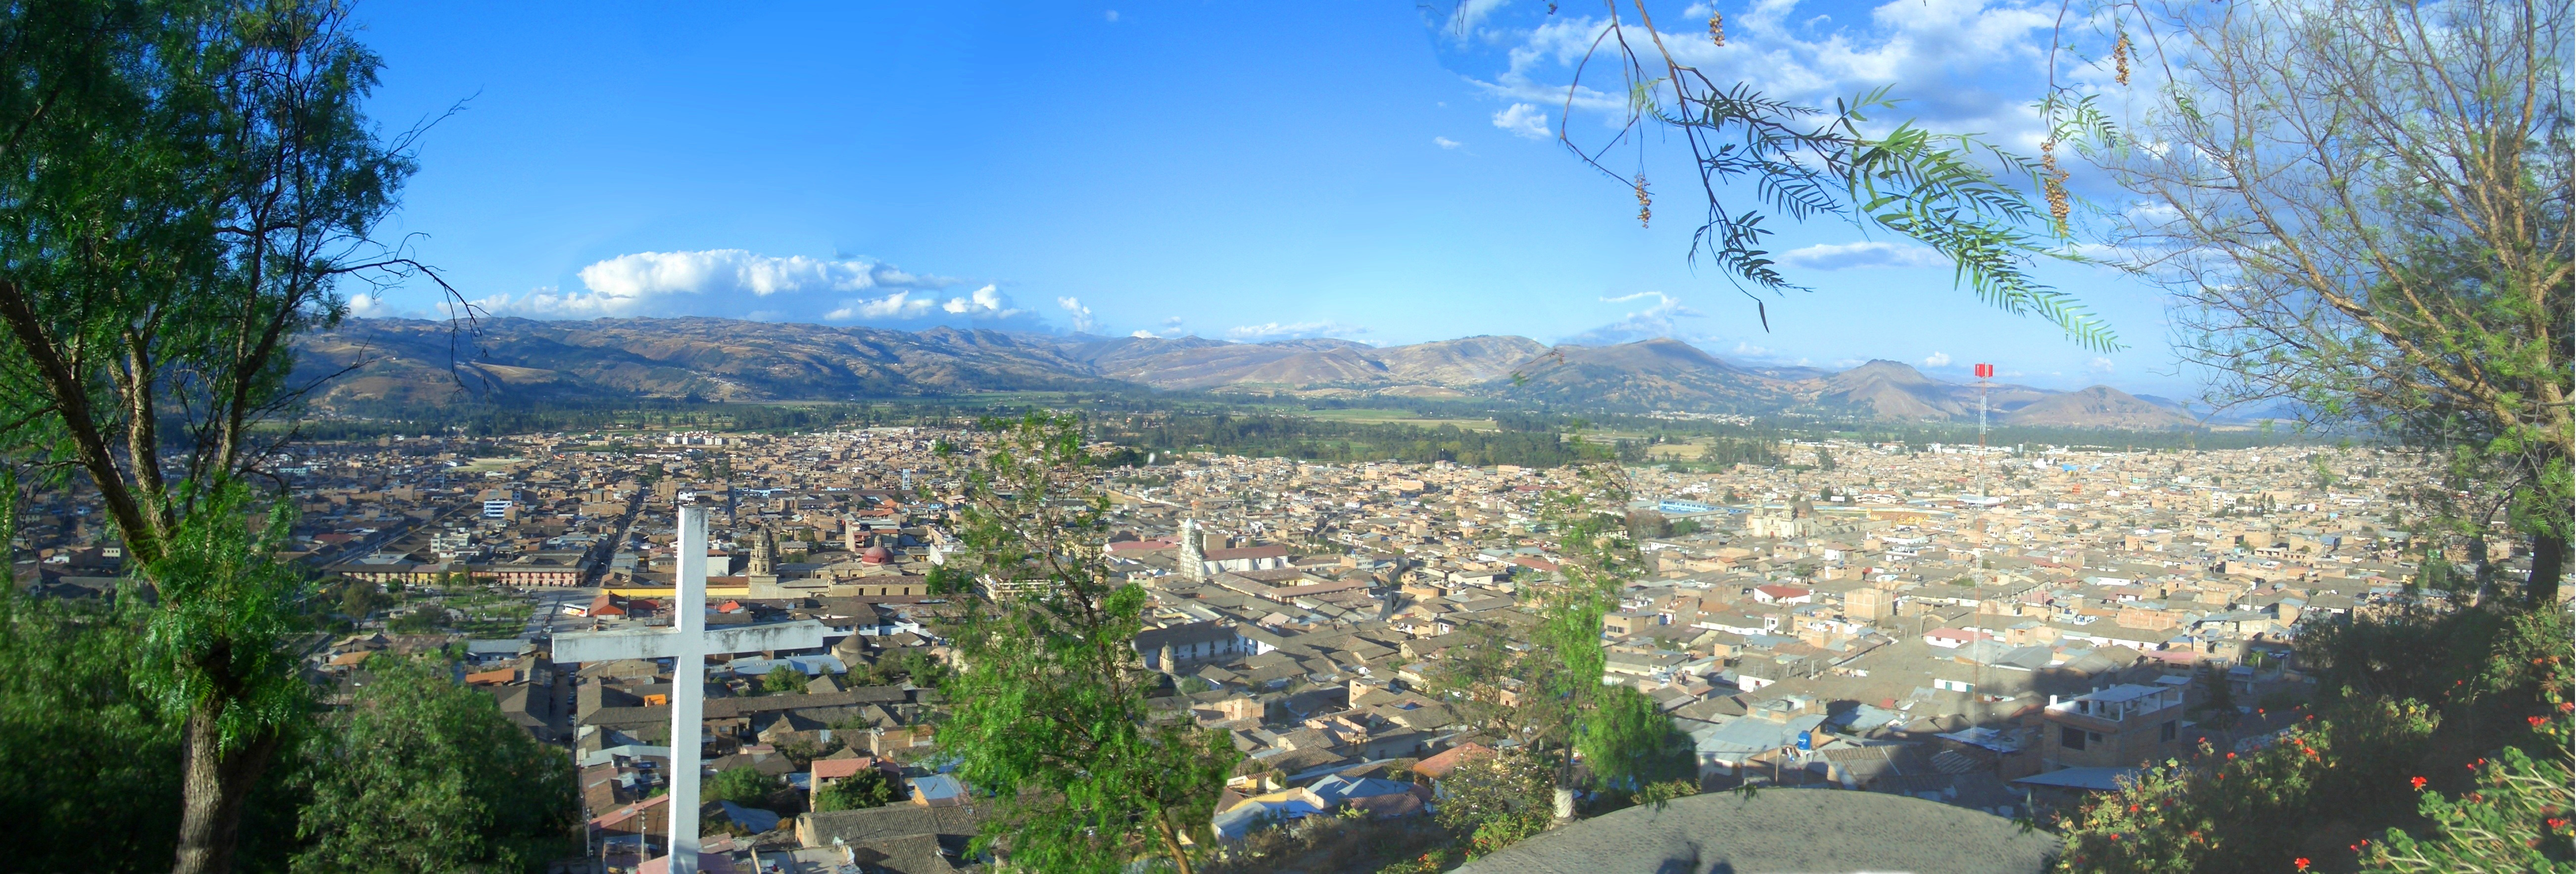
Mapa de: Celendín
Mapa interactiu
Població de Celendín
Anys 1975 a 2020
| Data | 1975 | 1990 | 2000 | 2015 | 2020 |
|---|---|---|---|---|---|
| Població | 13.615 | 20.397 | 23.914 | 26.607 | 26.807 |
| Densitat de població | 41,2 / km² | 61,7 / km² | 72,3 / km² | 80,5 / km² | 81,1 / km² |
Fonts: JRC (European Commission's Joint Research Centre) treball al GHS built-up grid
Canvi de població de Celendín des de 2000 fins a 2015
Augment del 11.3% des de l'any 2000 fins al 2015
| Ubicació | Canvi des de 1975 | Canvi des de 1990 | Canvi des de 2000 |
|---|---|---|---|
| Celendín | +95.4% | +30.4% | +11.3% |
| Regió de Cajamarca | +48.5% | +14.2% | +4.2% |
| Perú | +104.4% | +42.6% | +20.2% |
Fonts: JRC (European Commission's Joint Research Centre) treball al GHS built-up grid
Edat mediana de Celendín
Edat mediana: 23.2 anys
| Ubicació | Edat mitjana | Edat mitjana (dona) | Edat mitjana (masculí) |
|---|---|---|---|
| Celendín | 23.2 yrs | 23.9 yrs | 22.5 yrs |
| Regió de Cajamarca | 22.8 yrs | 23.3 yrs | 22.3 yrs |
| Perú | 25.1 yrs | 25.6 yrs | 24.6 yrs |
Fonts: CIESIN (Center for International Earth Science Information Network)
Densitat de població de Celendín
Densitat de població: 81,1 / km²
| Ubicació | Població | àrea | Densitat |
|---|---|---|---|
| Celendín | 26.807 | 330,7 km² | 81,1 / km² |
| Regió de Cajamarca | 1,5 million | 32.940,7 km² | 44,4 / km² |
| Perú | 31 million | 1.291.975 km² | 24 / km² |
Fonts: JRC (European Commission's Joint Research Centre) treball al GHS built-up grid
Població històrica i projectada de Celendín
Població estimada des de 0 fins a 2100
Fonts:
- JRC (European Commission's Joint Research Centre) treball al GHS built-up grid
- CIESIN (Center for International Earth Science Information Network)
- [Enllaç] Klein Goldewijk, K., Beusen, A., Doelman, J., and Stehfest, E.: Anthropogenic land use estimates for the Holocene – HYDE 3.2, Earth Syst. Sci. Data, 9, 927–953, https://doi.org/10.5194/essd-9-927-2017, 2017.
Índex de desenvolupament humà (HDI)
Índex compost estadístic de l'esperança de vida, l'educació i la renda per càpita.
Font: [Enllaç] Kummu, M., Taka, M. &Guillaume, J. Gridded global datasets for Gross Domestic Product and Human Development Index over 1990–2015. Sci Data 5, 180004 (2018) doi:10.1038/sdata.2018.4
Emissions de CO2 de Celendín
Emissions de diòxid de carboni (CO2) per càpita en tones a l'any
| Ubicació | Emissions de CO2 | Emissions de CO2 per càpita | Intensitat d'emissions de CO2 |
|---|---|---|---|
| Celendín | 54,980 tn | 2.05 tn | 166.3 tons/km² |
| Regió de Cajamarca | 2,997,835 tn | 2.05 tn | 91 tons/km² |
| Perú | 71,626,946 tn | 2.31 tn | 55.4 tons/km² |
Fonts: [Enllaç] Moran, D., Kanemoto K; Jiborn, M., Wood, R., Többen, J., and Seto, K.C. (2018) Carbon footprints of 13,000 cities. Environmental Research Letters DOI: 10.1088/1748-9326/aac72a
Emissions de CO2 de Celendín
| Emissions de CO2 de 2013 (tones/any) | 54,980 tn |
| Emissions de CO2 de 2013 (tones/any) per capita | 2.05 tn |
| Intensitat d'emissions de CO2 de 2013 (tones/km²/any) | 166.3 tons/km² |
Riscos naturals
Risc sobre 10
| Perill | Nivell de risc |
|---|---|
| La sequera | Baix (2) |
| Inundació | Mitjà (7) |
| Terratrèmol | Mitjà (7) |
| Esllavissament de terra | Mitjà (7) |
* El risc, sobretot pel que fa a inundacions o esllavissades de terra, pot no ser de tota la zona.
Fonts:
- Dilley, M., R.S. Chen, U. Deichmann, A.L. Lerner-Lam, M. Arnold, J. Agwe, P. Buys, O. Kjekstad, B. Lyon, and G. Yetman. 2005. Natural Disaster Hotspots: A Global Risk Analysis. Washington, D.C.: World Bank. https://doi.org/10.1596/0-8213-5930-4.
- Center for Hazards and Risk Research - CHRR - Columbia University, Center for International Earth Science Information Network - CIESIN - Columbia University, and Norwegian Geotechnical Institute - NGI. 2005. Global Landslide Hazard Distribution. Palisades, NY: NASA Socioeconomic Data and Applications Center (SEDAC). https://doi.org/10.7927/H4P848VZ.
- Center for Hazards and Risk Research - CHRR - Columbia University, Center for International Earth Science Information Network - CIESIN - Columbia University, and International Research Institute for Climate and Society - IRI - Columbia University. 2005. Global Drought Hazard Frequency and Distribution. Palisades, NY: NASA Socioeconomic Data and Applications Center (SEDAC). https://doi.org/10.7927/H4VX0DFT.
- Center for Hazards and Risk Research - CHRR - Columbia University, Center for International Earth Science Information Network - CIESIN - Columbia University. 2005. Global Flood Hazard Frequency and Distribution. Palisades, NY: NASA Socioeconomic Data and Applications Center (SEDAC). https://doi.org/10.7927/H4668B3D.
- Center for Hazards and Risk Research - CHRR - Columbia University, Center for International Earth Science Information Network - CIESIN - Columbia University. 2005. Global Earthquake Hazard Distribution - Peak Ground Acceleration. Palisades, NY: NASA Socioeconomic Data and Applications Center (SEDAC). https://doi.org/10.7927/H4BZ63ZS.
Terratrèmols propers recents
Magnitud 3.0 i superior
| Data▼ | Hora↕ | Magnitude↕ | Distance↕ | Profunditat↕ | Ubicació↕ | Enllaç |
|---|---|---|---|---|---|---|
| 4/11/05 | 2:54 PM | 6 | 55.3 km | 129,900 m | northern Peru | usgs.gov |
| 12/1/98 | 2:55 PM | 4.5 | 68.5 km | 33,000 m | northern Peru | usgs.gov |
| 6/20/94 | 10:02 AM | 4.6 | 2.6 km | 125,000 m | northern Peru | usgs.gov |
| 8/30/85 | 4:44 AM | 4.3 | 92.4 km | 33,000 m | northern Peru | usgs.gov |
| 7/30/79 | 1:43 PM | 4.6 | 22.3 km | 33,000 m | northern Peru | usgs.gov |
| 5/20/79 | 1:43 AM | 5.7 | 94.3 km | 33,000 m | northern Peru | usgs.gov |
| 3/5/74 | 12:55 AM | 4 | 66 km | 235,000 m | northern Peru | usgs.gov |

Sobre les nostres dades
Les dades d'aquesta pàgina s'estimen utilitzant diverses eines i recursos disponibles públicament. Es proporciona sense garantia i pot contenir inexactituds. Utilitzeu-lo sota el vostre propi risc.